
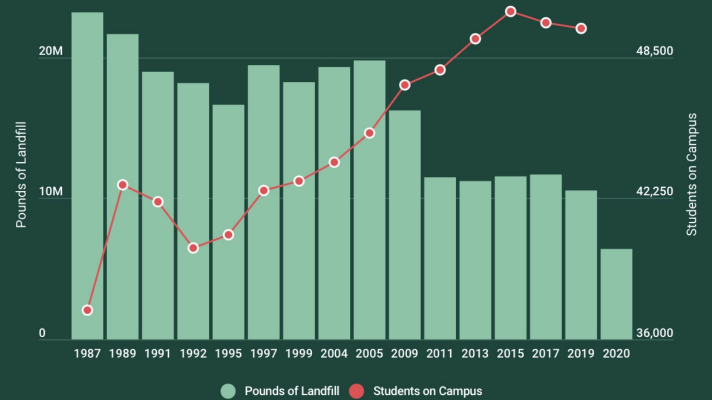
Landfill down by 66% since '87
Posted by Katie Deska on Feb 12th 2021
Sometimes numbers speak louder than words. For that reason, we're shining a light on Our Impact, which includes waste collection and diversion data from all over campus, including event spaces and residential halls. Many graphs are building specific (see the drop down menu just below the graph title) and showcase 12-month cumulative trends – each month includes the data from the previous months of that year. Some graphs date back to the 1980s, when our recycling program began. If that interests you, check out Our Story for a timeline of SSRC.
When it comes to MSU’s landfill footprint, Spartans have reason to celebrate, and yet plenty of room to improve. Here’s a snapshot:
- Since 1987, when the campus recycling program began, MSU has decreased its yearly landfill totals by 55% and the annual amount of landfill produced per student by 66%.
- Yet, MSU can produce up to over 30,000 lbs. trash PER DAY!
Over the last four years, on-campus trash per person, per day is down 37% while statewide that number has increased 14% over the same period. Provided there are 60,000 people on campus, that’s a half pound of trash per day per person that we produce on campus. It’s notable that this is drastically less than the eight pounds of trash produced per person, per day statewide. However, we’re not quite comparing apples to apples. The statewide number pertains to residential trash, and only a portion of the 60,000 people who are on campus daily live here 24/7, many are here only 8-9 hours or less.
We share this data with you with the hope that it further empowers you to choose your impact and educate your peers to do the same.